
MMM-Zabbix-Graphs
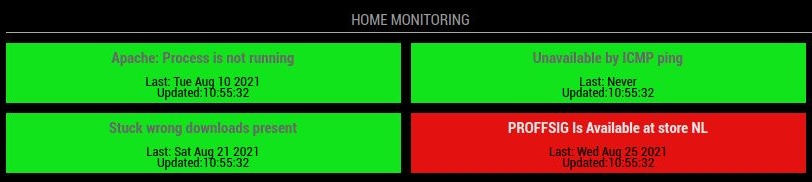
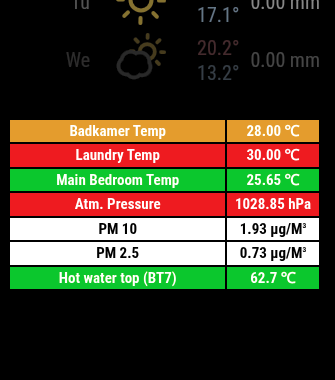
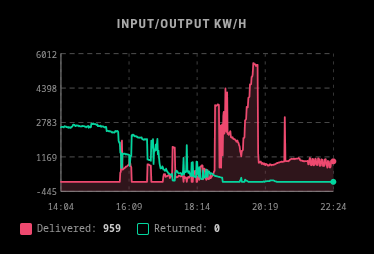
MagicMirror² module that fetches numeric item history from Zabbix and renders a live SVG time-series graph. Supports multiple items overlaid on the same graph, optional area fill per line, and two display sizes for side columns or a full-width center panel.
Installation
cd MagicMirror/modules
git clone [email protected]:spectronet/mmm-zabbix-graphs.git
No extra npm dependencies — uses MagicMirror's built-in node_helper and native fetch.
Configuration
Add to MagicMirror/config/config.js:
{
    module: "mmm-zabbix-graphs",
    position: "bottom_bar",        // see Size section below
    config: {
        zbx_user:       "youruser",
        zbx_pass:       "yourpass",
        apiSearch:      "http://zabbix.host/api_jsonrpc.php",
        itemIds:        ["12345", "67890"],
        historyHours:   6,
        historyType:    3,
        size:           "full",
        graphTitle:     "Network Traffic",
        updateInterval: 300000,
        colors: [
            "#00b4d8,F",
            "#f4a261",
            "#06d6a0,F",
        ],
    }
}
Options
| Option | Type | Default | Description |
|---|---|---|---|
zbx_user |
string | "GETYOUROWNUSER" |
Zabbix API username |
zbx_pass |
string | "GETYOUROWNPASS" |
Zabbix API password |
apiSearch |
string | "http://monitor.science.net/api_jsonrpc.php" |
Full URL to the Zabbix JSON-RPC API endpoint |
itemIds |
array | [] |
Array of Zabbix item ID strings to graph. Find them in the Zabbix URL: ?itemid=XXXXX |
historyHours |
number | 6 |
How many hours of history to fetch and display |
historyType |
number | 3 |
Zabbix history value type: 0=float, 3=integer. Must match the item's actual type in Zabbix |
size |
string | "third" |
"third" for narrow side column (~340px), "full" for wide center panel (~820px) |
graphTitle |
string | "" |
Optional heading displayed above the graph. Leave empty to hide |
updateInterval |
number | 300000 |
Milliseconds between data refreshes. Default is 5 minutes |
animationSpeed |
number | 1000 |
DOM update animation speed in ms |
initialLoadDelay |
number | 2500 |
Delay before first fetch on startup (ms). Stagger multiple modules to avoid hammering the API |
retryDelay |
number | 120000 |
Delay before retry after any API failure (ms) |
colors |
array | see below | Color definition per item line — see Color Syntax section |
showGrid |
boolean | true |
Show horizontal and vertical grid lines inside the graph. Axis labels always visible regardless |
Color Syntax
Each entry in colors maps to the corresponding itemIds index (cycles if fewer colors than items).
"#rrggbb"      — line only, no fill
"#rrggbb,T"    — line only (explicit transparent, same as bare)
"#rrggbb,F"    — line + filled area under the curve (18% opacity)
Examples:
colors: [
    "#00b4d8,F",   // cyan line with filled area underneath
    "#f4a261",     // orange line only
    "#06d6a0,F",   // green line with fill
    "#ef476f,T",   // red line only (explicit)
]
The legend below the graph shows a solid swatch for filled items and a hollow swatch for line-only items, along with the item name and its most recent value.
Size and Position
size |
Recommended position values |
Width |
|---|---|---|
"third" |
top_left, top_right, bottom_left, bottom_right, middle_center |
~340px |
"full" |
bottom_bar, top_bar, lower_third |
100% of region |
Zabbix API Pipeline
Each refresh cycle runs:
user.login— obtains a Bearer tokenitem.get— fetches item names and last values for the legendhistory.get— fetches the newest data points within thehistoryHourswindow, so the graph stays current even when the API result limit is reached
Requires Zabbix 6.0+ (Bearer token authentication). For older Zabbix versions using session-token auth, the Authorization header format may need adjustment.
License
MIT — By Spectroman